
Next
Enterprise B2B · AI analytics
Designing a 0-1 conversational data analysis experience
Making work data easier to seek, trust, and share.
Role
I owned interaction design, prototyping, and validation for the 0→1 enterprise AI analytics experience.
Scope
Strategy, interaction, prototyping, research
Team
PD · PM · DS · UXR · 2 SWE
Timeline
2024–2025 · from private beta to general availability
Status
Generally available
Overview
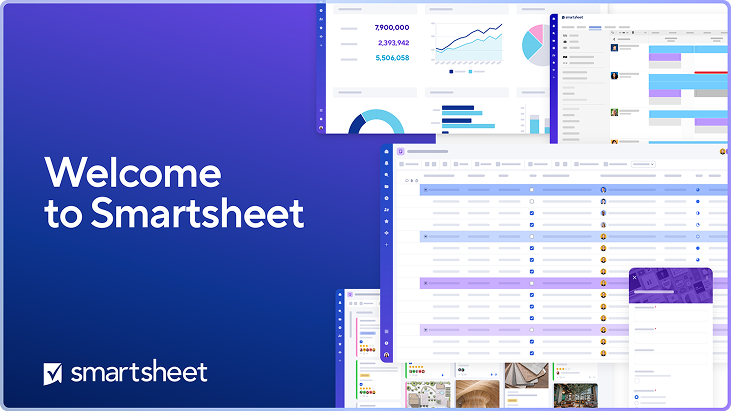
Smartsheet is a cloud-based project management platform that looks like a spreadsheet on steroids. It takes regular rows and columns and supercharges them with Gantt charts, automated alerts, and resource tracking so teams can collaborate, map out complex workflows, and manage timelines in one central hub.
The TLDR
Smartsheet has a plethora of enterprise work data but users currently need to pay a heavy setup tax to turn any of it into intelligible insights. The team shipped a conversational analytics experience that enables users to ask about their data in plain language. Along the way, we learned that a Q&A experience wasn't enough. Users wanted to know further details to understand how answers were being formulated as well as act on the responses that were being generated. A rocky private beta guided the team towards feature hypotheses that brought the feature out of beta, ultimately shipping an E2E experience where users could query, generate, refine, validate, and share insights in one conversational workflow.
2.61k
analysis plans in the launch period
2,080
unique users in a single day
31%
of users retained at day 30
The problem
Users have access to work data, yet turning it into decision-making insight is highly manual and time consuming.
Today's experience
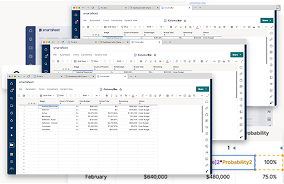
Prepare the data
Users need a janitorial step of cleaning, filtering, and grouping data before any usage.
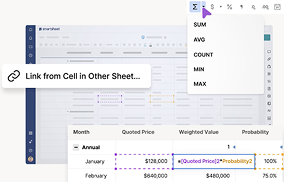
Build the logic
They are also often asked to write formulas or helper calculations to produce results.
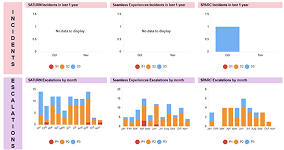
Create charts
Then they need to set up charts and place them in dashboards for consumption.
View Insights
Resulting in a slow to create and hard to repeat experience that's dependent on reporting expertise.
Prepare the data
Users need a janitorial step of cleaning, filtering, and grouping data before any usage.
Build the logic
They are also often asked to write formulas or helper calculations to produce results.
Create charts
Then they need to set up charts and place them in dashboards for consumption.
View Insights
Resulting in a slow to create and hard to repeat experience that's dependent on reporting expertise.
Opportunity
Enable users to seek insights in the language of work, not in formulas, helper sheets, or chart configuration.
Enter password